Collecting Job Data Using APIs (Personal Project)
This notebook is part of my personal data analytics project. Here, I collect and analyze job data using APIs for my own learning and portfolio.
Collecting Job Data Using APIs
Estimated time needed: 45 to 60 minutes
Objectives
After completing this lab, you will be able to:
- Collect job data from Jobs API
- Store the collected data into an excel spreadsheet.
Note: Before starting with the assignment make sure to read all the instructions and then move ahead with the coding part.
Instructions
To run the actual lab, firstly you need to click on the Jobs_API notebook link. The file contains flask code which is required to run the Jobs API data.
Now, to run the code in the file that opens up follow the below steps.
Step1: Download the file.
Step2: Upload it on the IBM Watson studio. (If IBM Watson Cloud service does not work in your system, follow the alternate Step 2 below)
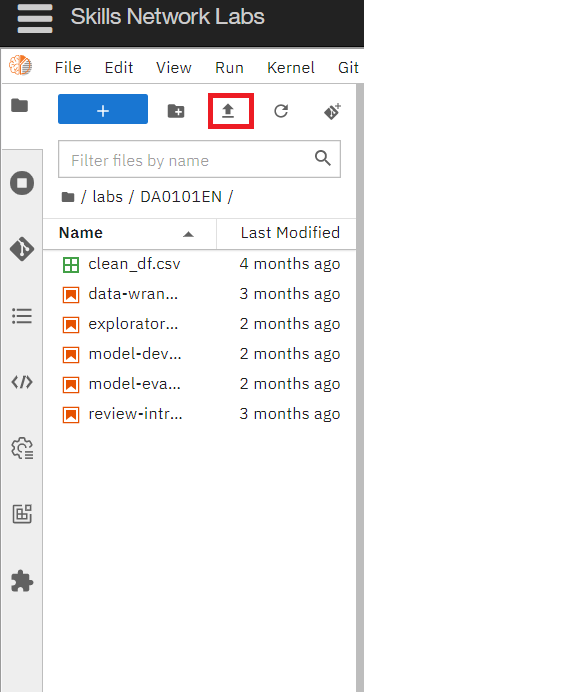
Step2(alternate): Upload it in your SN labs environment using the upload button which is highlighted in red in the image below: Remember to upload this Jobs_API file in the same folder as your current .ipynb file
Step3: Run all the cells of the Jobs_API file. (Even if you receive an asterik sign after running the last cell, the code works fine.)
If you want to learn more about flask, which is optional, you can click on this link here.
Once you run the flask code, you can start with your assignment.
Dataset Used in this Assignment
The dataset used in this lab comes from the following source: https://www.kaggle.com/promptcloud/jobs-on-naukricom under the under a Public Domain license.
Note: We are using a modified subset of that dataset for the lab, so to follow the lab instructions successfully please use the dataset provided with the lab, rather than the dataset from the original source.
The original dataset is a csv. We have converted the csv to json as per the requirement of the lab.
Warm-Up Exercise
Before you attempt the actual lab, here is a fully solved warmup exercise that will help you to learn how to access an API.
Using an API, let us find out who currently are on the International Space Station (ISS).
The API at http://api.open-notify.org/astros.json gives us the information of astronauts currently on ISS in json format.
You can read more about this API at http://open-notify.org/Open-Notify-API/People-In-Space/
import requests # you need this module to make an API call
import pandas as pd
api_url = "http://api.open-notify.org/astros.json" # this url gives use the astronaut data
response = requests.get(api_url) # Call the API using the get method and store the
                                # output of the API call in a variable called response.
if response.ok:             # if all is well() no errors, no network timeouts)
    data = response.json()  # store the result in json format in a variable called data
                            # the variable data is of type dictionary.
print(data) # print the data just to check the output or for debugging
{'number': 10, 'people': [{'name': 'Oleg Artemyev', 'craft': 'ISS'}, {'name': 'Denis Matveev', 'craft': 'ISS'}, {'name': 'Sergey Korsakov', 'craft': 'ISS'}, {'name': 'Kjell Lindgren', 'craft': 'ISS'}, {'name': 'Bob Hines', 'craft': 'ISS'}, {'name': 'Samantha Cristoforetti', 'craft': 'ISS'}, {'name': 'Jessica Watkins', 'craft': 'ISS'}, {'name': 'Cai Xuzhe', 'craft': 'Tiangong'}, {'name': 'Chen Dong', 'craft': 'Tiangong'}, {'name': 'Liu Yang', 'craft': 'Tiangong'}], 'message': 'success'}
Print the number of astronauts currently on ISS.
print(data.get('number'))
10
Print the names of the astronauts currently on ISS.
astronauts = data.get('people')
print("There are {} astronauts on ISS".format(len(astronauts)))
print("And their names are :")
for astronaut in astronauts:
    print(astronaut.get('name'))
There are 10 astronauts on ISS
And their names are :
Oleg Artemyev
Denis Matveev
Sergey Korsakov
Kjell Lindgren
Bob Hines
Samantha Cristoforetti
Jessica Watkins
Cai Xuzhe
Chen Dong
Liu Yang
Hope the warmup was helpful. Good luck with your next lab!
Lab: Collect Jobs Data using Jobs API
Objective: Determine the number of jobs currently open for various technologies and for various locations
Collect the number of job postings for the following locations using the API:
- Los Angeles
- New York
- San Francisco
- Washington DC
- Seattle
- Austin
- Detroit
#Import required libraries
import pandas as pd
import json
Write a function to get the number of jobs for the Python technology.
Note: While using the lab you need to pass the payload information for the params attribute in the form of key value pairs.
Refer the ungraded rest api lab in the course Python for Data Science, AI & Development link
The keys in the json are
Job Title
Job Experience Required
Key Skills
Role Category
Location
Functional Area
Industry
Role
You can also view the json file contents from the following json URL.
api_url="http://127.0.0.1:5000/data"
def get_number_of_jobs_T(technology):
    #your code goes here
    number_of_jobs = 0
    payload={"Key Skills":technology}
    response=requests.get(api_url,params=payload)
    if response.ok:             # if all is well() no errors, no network timeouts)
        data = response.json()  # store the result in json format in a variable called data
                                # the variable data is of type dictionary.
        number_of_jobs= number_of_jobs + len(data)
    return technology,number_of_jobs
Calling the function for Python and checking if it works.
get_number_of_jobs_T("Python")
('Python', 1173)
Write a function to find number of jobs in US for a location of your choice
def get_number_of_jobs_L(location):

    #your coe goes here
    number_of_jobs = 0
    payload={"Location":location}
    response=requests.get(api_url,params=payload)
    if response.ok:             # if all is well() no errors, no network timeouts)
        data = response.json()  # store the result in json format in a variable called data
                                # the variable data is of type dictionary.
        number_of_jobs= number_of_jobs + len(data)
    return location,number_of_jobs
Call the function for Los Angeles and check if it is working.
#your code goes here
get_number_of_jobs_L("Washington DC")
('Washington DC', 5316)
Store the results in an excel file
Call the API for all the given technologies above and write the results in an excel spreadsheet.
If you do not know how create excel file using python, double click here for hints.
Create a python list of all locations for which you need to find the number of jobs postings.
#your code goes here
location = ["Los Angeles","New York","San Francisco","Washington DC","Seattle","Austin","Detroit"]
Import libraries required to create excel spreadsheet
# your code goes here
from openpyxl import Workbook        # import Workbook class from module openpyxl
Create a workbook and select the active worksheet
# your code goes here
wb=Workbook()                        # create a workbook object
Find the number of jobs postings for each of the location in the above list. Write the Location name and the number of jobs postings into the excel spreadsheet.
ws=wb.active                         # use the active worksheet
ws.append(['City','Number of Jobs'])   # add a row with two columns 'City' and 'Number of Jobs'
#your code goes here
for i in range(len(location)):
    n = get_number_of_jobs_L(location[i])
    ws.append(n)     # add a row with two columns 'location' and 'get_number_of_jobs_L(location)' value
Save into an excel spreadsheet named 'job-postings.xlsx'.
#your code goes here
wb.save("job-postings-location.xlsx")            # save the workbook into a file called countries.xlsx
print("Successfully Saved")
Successfully Saved
In the similar way, you can try for below given technologies and results can be stored in an excel sheet.
Collect the number of job postings for the following languages using the API:
- C
- C#
- C++
- Java
- JavaScript
- Python
- Scala
- Oracle
- SQL Server
- MySQL Server
- PostgreSQL
- MongoDB
# your code goes here
wb=Workbook()                        # create a workbook object
ws=wb.active                         # use the active worksheet
technology = ["C","C#","C++","Java","JavaScript","Python","Scala","Oracle","SQL Server","MySQL Server","PostgreSQL","MongoDB"]
ws.append(['Technology','Number of Jobs'])   # add a row with two columns 'Technology' and 'Number of Jobs'
#your code goes here
for i in range(len(technology)):
    n = get_number_of_jobs_T(technology[i])
    ws.append(n)     # add a row with two columns 'technology' and 'get_number_of_jobs_L(technology)' value
wb.save("job-postings-technology.xlsx")            # save the workbook into a file called job-postings-technology.xlsx
print("Successfully Saved")
Successfully Saved
import pandas as pd
import seaborn as sns
import numpy as np

# use the inline backend to generate the plots within the browser
%matplotlib inline

import matplotlib as mpl
import matplotlib.pyplot as plt

mpl.style.use('ggplot') # optional: for ggplot-like style

# check for latest version of Matplotlib
# print ('Matplotlib version: ', mpl.__version__) # >= 2.0.0

df = pd.read_excel("job-postings-location.xlsx")


df = df.set_index("City")
# df["count"]=df["count"].astype('int')
df = df.sort_values("Number of Jobs",axis = 0, ascending = True)

fig, ax = plt.subplots(figsize=(12,6))
# df.rename(columns={'count':'Total People Opinion'}, inplace=True)

df.plot(kind='barh', legend = False, ax=ax, color='dodgerblue')
ax.set_xlabel('Number of Jobs',color='black',fontfamily="Montserrat",fontsize=14)
ax.set_ylabel('City',color='black',fontfamily="Montserrat",fontsize=14)
ax.set_title('Number of Jobs in US',color='black',fontfamily="Montserrat",fontsize=20,loc='left')
ax.set_facecolor('whitesmoke')
ax.tick_params(axis='x', colors='black')    #setting up X-axis tick color to black
ax.tick_params(axis='y', colors='black')    #setting up Y-axis tick color to black
plt.rcParams["font.family"] = "Montserrat"
plt.grid(visible=None)


# annotate value labels to each country
for i in range(len(df)): #enamurate returns tuple
    # print(df["Total People Opinion"][i])
    value = df["Number of Jobs"][i]
    label = format(int(value), ',') # format int with commas

# place text at the end of bar (subtracting 700 from x, and 0.1 from y to make it fit within the bar)
    plt.annotate(label, xy=(value-300, i-0.1), color='snow')
plt.savefig("us_jobs.png")
plt.show()

import pandas as pd
import seaborn as sns
import numpy as np

# use the inline backend to generate the plots within the browser
%matplotlib inline

import matplotlib as mpl
import matplotlib.pyplot as plt

mpl.style.use('ggplot') # optional: for ggplot-like style

# check for latest version of Matplotlib
# print ('Matplotlib version: ', mpl.__version__) # >= 2.0.0

df = pd.read_csv("popular-languages.csv")


df = df.set_index("Language")
df = df.sort_values("Average Annual Salary",axis = 0, ascending = True)

# df["count"]=df["count"].astype('int')


fig, ax = plt.subplots(figsize=(12,6))

df.plot(kind='barh', legend = False, ax=ax, color='mediumturquoise')
ax.set_xlabel('Average Annual Salary',color='black',fontfamily="Montserrat",fontsize=14)
ax.set_ylabel('Language',color='black',fontfamily="Montserrat",fontsize=14)
ax.set_title('Average Annual Salary in US',color='black',fontfamily="Montserrat",fontsize=20,loc='left')
ax.set_facecolor('whitesmoke')

ax.tick_params(axis='x', colors='black')    #setting up X-axis tick color to black
ax.tick_params(axis='y', colors='black')    #setting up Y-axis tick color to black

plt.rcParams["font.family"] = "Montserrat"
plt.grid(visible=None)


# annotate value labels to each country
for i in range(len(df)): #enamurate returns tuple
    # print(df["Total People Opinion"][i])
    value = df["Average Annual Salary"][i]
    label = format(int(value), ',') # format int with commas

# place text at the end of bar (subtracting 700 from x, and 0.1 from y to make it fit within the bar)
    plt.annotate("$"+label, xy=(value-10000, i-0.1), color='black')
plt.savefig("annual_salary.png")
plt.show()

Copyright © 2022 IBM Corporation. All rights reserved.